Blood biomarkers we test at Elo and how they factor into your personalized nutrition plan
Measuring blood biomarkers is an excellent way to get a better understanding of your overall health and nutritional status. Learn more about what biomarkers we test at Elo Health to create a Smart Nutrition plan that’s tailored to your body’s needs.

When it comes to nutrition, there’s not a “one size fits all” approach. While many companies offer “personalized nutrition” services based on generic questionnaires, we take personalized nutrition several steps further and incorporate blood biomarker results, wearable data, and personal goals to come up with the right nutrition and supplement plan for you.
This article covers what biomarkers we test at Elo and how they inform your personalized plan. Blood biomarkers aren’t a standalone strategy for assessing your personal nutrition needs, however, they help identify nutrient gaps and reveal important insights about your metabolic health.

What we test
At Elo, we currently test the following biomarkers using dried-blood spot testing technology:
Total cholesterol: This is a measure of the total amount of cholesterol in your blood, including LDL, HDL, and triglycerides. High cholesterol is a risk factor for heart disease, and testing cholesterol levels provides insight about heart disease risk, inflammation, and vascular function [ 1
HDL cholesterol: HDL is known as the “good” cholesterol, and helps lower your risk of heart disease by recirculating LDL cholesterol back to the liver to be excreted [ 2
Learn how you can increase your HDL levels without medication
here
.
LDL cholesterol: Also known as “bad” cholesterol, high LDL levels are a risk factor for heart attack, stroke, and atherosclerosis [ 2
Learn how you can lower your LDL cholesterol without medication
here
.
Triglycerides: Elevated triglycerides is another factor which can increase your risk for heart attack and stroke [ 2 3
Cholesterol/HDL ratio: This is a measure of the ratio of total cholesterol to HDL cholesterol in your blood, which can be more useful than knowing either level alone in predicting risk for disease [ 4
LDL/HDL ratio: This is a measure of the ratio of LDL to HDL cholesterol in your blood. Since HDL helps to eliminate LDL, a higher ratio of LDL to HDL can be predictive of heart disease.
VLDL: This is an estimate of the amount of very-low-density lipoprotein in your blood. VLDL is another type of cholesterol that is responsible for transporting triglycerides. Like LDL, VLDL can build up in blood vessels and increase your risk of heart disease, heart attack, and stroke. VLDL levels are estimated using triglycerides levels since there’s no way to measure VLDL directly. As a result, lifestyle changes that lower triglycerides such as cutting back on added sugar, increasing physical activity, and limiting alcohol, also tend to lower VLDL.
Homocysteine: This is an amino acid produced when proteins are broken down in the body. High homocysteine may indicate inadequate B12, B6, and/or folic acid intake, since all of these nutrients are necessary to metabolize this amino acid [ 5 6
Vitamin D: This biomarker measures the amount of 25(OH)D in your blood, which is the active form of vitamin D. Vitamin D plays an important role in bone health, immunity, and calcium absorption. We can synthesize vitamin D in skin from sunlight exposure and cholesterol, so if you are not exposed to sun (particularly during the winter months), you may have an increased risk of vitamin D deficiency. Vitamin D is found in few foods and many people rely on supplements to achieve adequate vitamin D levels.
Vitamin B12: This is a vitamin that plays a critical role in brain and nerve function, and blood cell production. Vegetarians, vegans, and older adults are at increased risk of vitamin B12 deficiency, which can cause serious health problems including confusion, memory loss, and nerve damage [ 7 8 9
Ferritin: This biomarker measures the blood protein ferritin, which stores iron. It is used as an indicator for your body’s iron levels, which is important for energy, cognition, and immunity. Low levels of ferritin may reflect low iron intake and be used as an indicator of iron deficiency and sometimes anemia. High ferritin levels are less common, but linked with conditions such as hemochromatosis, rheumatoid arthritis, hyperthyroidism, diabetes, inflammation, and liver disease, as well as excess alcohol consumption [ 10
HbA1C: This biomarker provides a deeper insight into blood sugar levels, and can help determine if your body is producing enough insulin or encountering insulin resistance. Elevated HbA1c levels may indicate prediabetes or diabetes, a disease that can increase risk of heart disease and cause permanent damage to nerves, the eyes and kidneys. These HbA1C test results are reported as a percentage. Levels in the 5.7-6.5% range are considered prediabetes and levels greater than 6.5% are classified as diabetes [ 11

How does the testing process work?
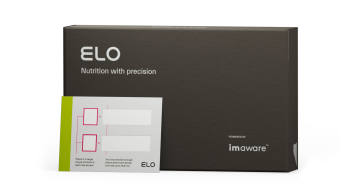
All blood samples are collected at home with a simple finger prick, so you never have to go into a lab to complete your biomarker tests. Learn how to collect your biomarker sample at home with this best-practice guide

How do biomarkers contribute to a personalized nutrition plan?
At Elo Health, we deliver Smart Nutrition by overlaying your blood biomarker results, wearable data, and questionnaire answers, with a proprietary analysis of over 3,500 clinical trials. Smart Nutrition recommendations are driven by an in-depth analysis of your biochemistry, personal goals, health history, and activity levels, and are constantly evolving to reflect your changing needs.
The ingredients in your custom supplement packets have been chosen for you based on your unique profile and the dosages calibrated to your goals and needs. Our supplements undergo rigorous third-party testing
Additionally, we recalibrate your nutrition plan as your goals and biomarker change. People and biomarkers change - and your nutrition strategies should too.
Learn more
about what we’re doing at Elo to deliver more accurate nutrition solutions for you.

Summary
At Elo Health, at-home biomarker testing is part of our comprehensive nutrition assessment. It helps us provide precise and effective nutrition recommendations just for you. Our blood biomarker panel includes cholesterol, homocysteine, vitamin B12, ferritin and more, and provides important insight into your nutrient gaps and metabolic health. It gives us a better understanding of how we can help improve your diet and lifestyle, and informs the right Smart Nutrition plan for you.
Disclaimer: The text, images, videos, and other media on this page are provided for informational purposes only and are not intended to treat, diagnose, or replace personalized medical care.
Key Takeaways
The biomarkers we test are indicators of disease risk and/or nutritional deficits and knowing your levels can help inform diet and lifestyle changes, in addition to allowing us to provide personalized supplements, precisely for you.
We currently test total cholesterol, HDL, LDL, triglycerides, cholesterol/HDL ratio, LDL/HDL ratio, VLDL, homocysteine, vitamin B12, vitamin D, and ferritin.
At Elo, we’re very particular about what we test. We’ve discontinued several markers because they yield inaccurate and/or inconsistent results, or don’t have a strong link with nutrition.
References:
How to get your cholesterol tested. www.heart.org. (n.d.). Retrieved November 1, 2021, from https://www.heart.org/en/health-topics/cholesterol/how-to-get-your-cholesterol-tested.
Grundy, S. M., Stone, N. J., Bailey, A. L., Beam, C., Birtcher, K. K., Blumenthal, R. S., Braun, L. T., de Ferranti, S., Faiella-Tommasino, J., Forman, D. E., Goldberg, R., Heidenreich, P. A., Hlatky, M. A., Jones, D. W., Lloyd-Jones, D., Lopez-Pajares, N., Ndumele, C. E., Orringer, C. E., Peralta, C. A., … Yeboah, J. (2019). 2018 AHA/ACC/AACVPR/AAPA/ABC/ACPM/ADA/AGS/APHA/ASPC/NLA/PCNA guideline on the management of blood cholesterol: A report of the American College of Cardiology/American Heart Association Task Force on Clinical Practice Guidelines. Circulation, 139(25).
https://doi.org/10.1161/cir.0000000000000625
Kota, S. K., Kota, S. K., Jammula, S., Krishna, S. V., & Modi, K. D. (2012). Hypertriglyceridemia-induced recurrent acute pancreatitis: A case-based review. Indian journal of endocrinology and metabolism, 16(1), 141–143.
https://doi.org/10.4103/2230-8210.91211
Calling, S., Johansson, S.-E., Wolff, M., Sundquist, J., & Sundquist, K. (2019). The ratio of total cholesterol to high density lipoprotein cholesterol and myocardial infarction in women’s health in the Lund Area (Whila): A 17-year follow-up cohort study. BMC Cardiovascular Disorders, 19(1). https://doi.org/10.1186/s12872-019-1228-7
Homocysteine: Levels, tests, high homocysteine levels. Cleveland Clinic. (n.d.). Retrieved November 1, 2021, from https://my.clevelandclinic.org/health/articles/21527-homocysteine.
Kumar, A., Palfrey, H. A., Pathak, R., Kadowitz, P. J., Gettys, T. W., & Murthy, S. N. (2017). The metabolism and significance of homocysteine in nutrition and health. Nutrition & metabolism, 14, 78.
https://doi.org/10.1186/s12986-017-0233-z
Serin, H. M., & Arslan, E. A. (2019). Neurological symptoms of vitamin B12 deficiency: analysis of pediatric patients. Acta clinica Croatica, 58(2), 295–302.
https://doi.org/10.20471/acc.2019.58.02.13
Laisk, T., Lepamets, M., Koel, M., Abner, E., Metspalu, A., Nelis, M., Milani, L., Esko, T., & Mägi, R. (2021). Genome-wide association study identifies five risk loci for pernicious anemia. Nature Communications, 12(1). https://doi.org/10.1038/s41467-021-24051-6
McMahon, G. M., Hwang, S. J., Tanner, R. M., Jacques, P. F., Selhub, J., Muntner, P., & Fox, C. S. (2015). The association between vitamin B12, albuminuria and reduced kidney function: an observational cohort study. BMC nephrology, 16, 7.
https://doi.org/10.1186/1471-2369-16-7
VanWagner, L. B., & Green, R. M. (2014). Elevated serum ferritin. JAMA, 312(7), 743–744.
https://doi.org/10.1001/jama.2014.302
Understanding A1C. Understanding A1C | ADA. (n.d.). Retrieved December 16, 2021, from
https://www.diabetes.org/a1c
.


